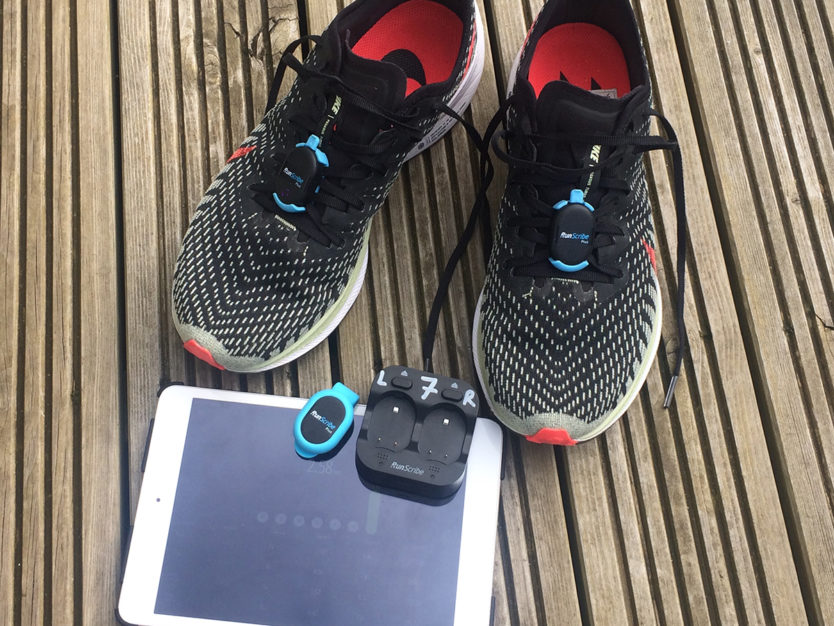
Over the past 6 years RunScribe has evolved into a comprehensive tool for understanding kinetic and kinematic information coming from the shoes and hence also the feet. In many cases the metrics generated reflect processes happening locally at or close to the feet. Others such as contact time, impact, ground reaction force and leg spring stiffness are influenced from more … Read More
RunScribe Comparative Data
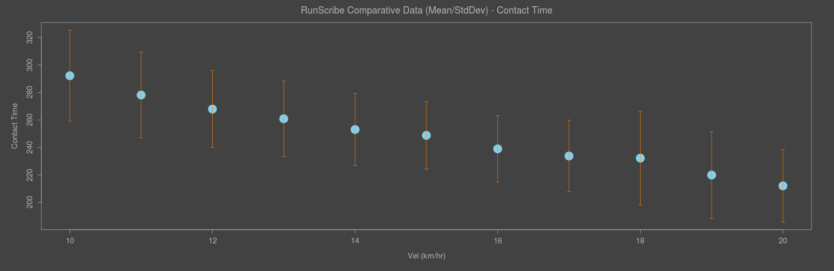
Author – Luis Enrique Roche When in the laboratory setting, as we assess how an athlete runs, we turn around over and over again the same questions: Are these normal values? Is this impact too high? Is that pronation velocity considered as a usual parameter for this level of runner? It is well-known that every single person exhibits a very … Read More
Shoe Ride Visualizations

As a progression to the ShoePrint framework that we launched early last year, I’m excited to announce our new ShoeRide visualizations! Where ShoePrints allowed you to see where on your shoe you were landing and taking-off, our ShoeRides now show the entire ground contact progression, from foot strike to toe off and all points in-between. We capture the stance progression … Read More
2019 Calgary Marathon 50K – Deep Dive
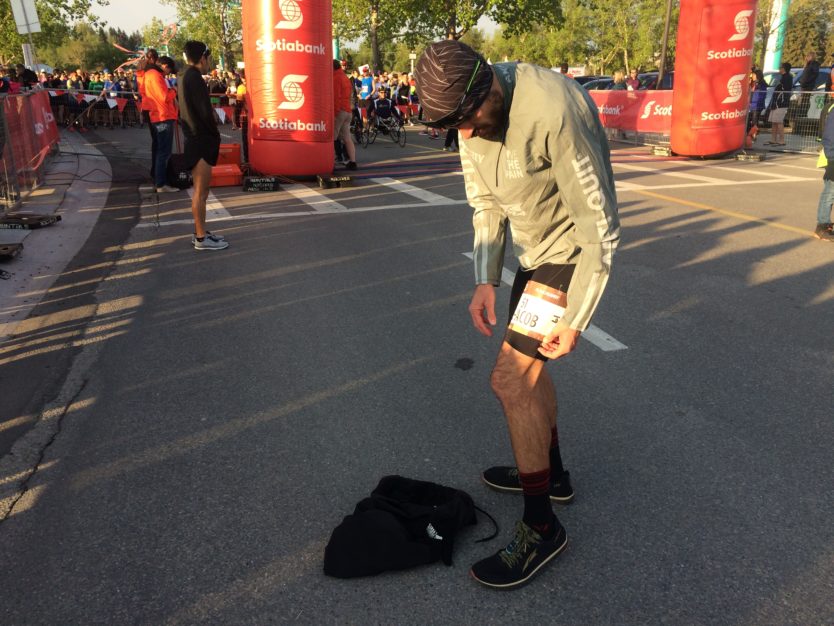
On the warm and sunny morning of Sunday 26th May Jacob Puzey ran a largely solo effort to win the Calgary Marathon 50k race in a time of 3 hours and 7 minutes. During the race Jacob was wearing a tiny set of sensors that were measuring his running gait from the gun to the tape. In this short article … Read More
NYC Marathon 2018 (Part 2) – ShoePrints
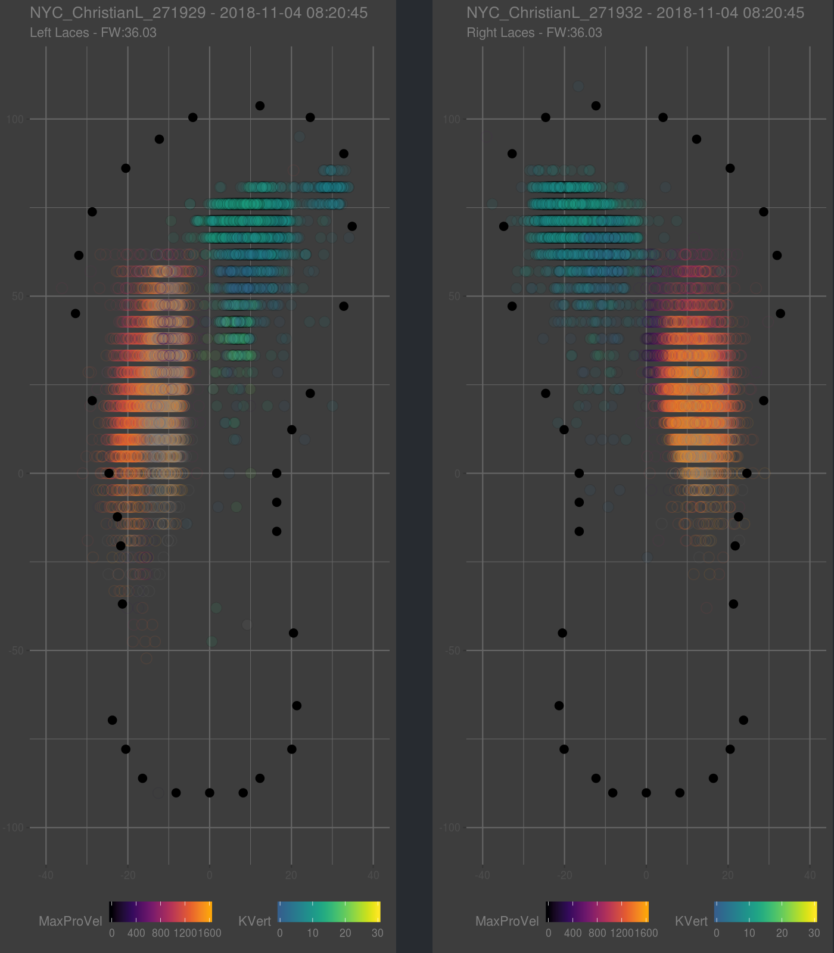
We were fortunate enough to collect data from 36 different runners at the 2018 NYC Marathon. Combined, they covered 943 miles in 1,356,559 steps, with RunScribe pods dutifully recording every single step. … and no two ShoePrint Contact Signatures are the same …
NYC Marathon 2018 (Part 1) – The Vaporfly Phenomenon
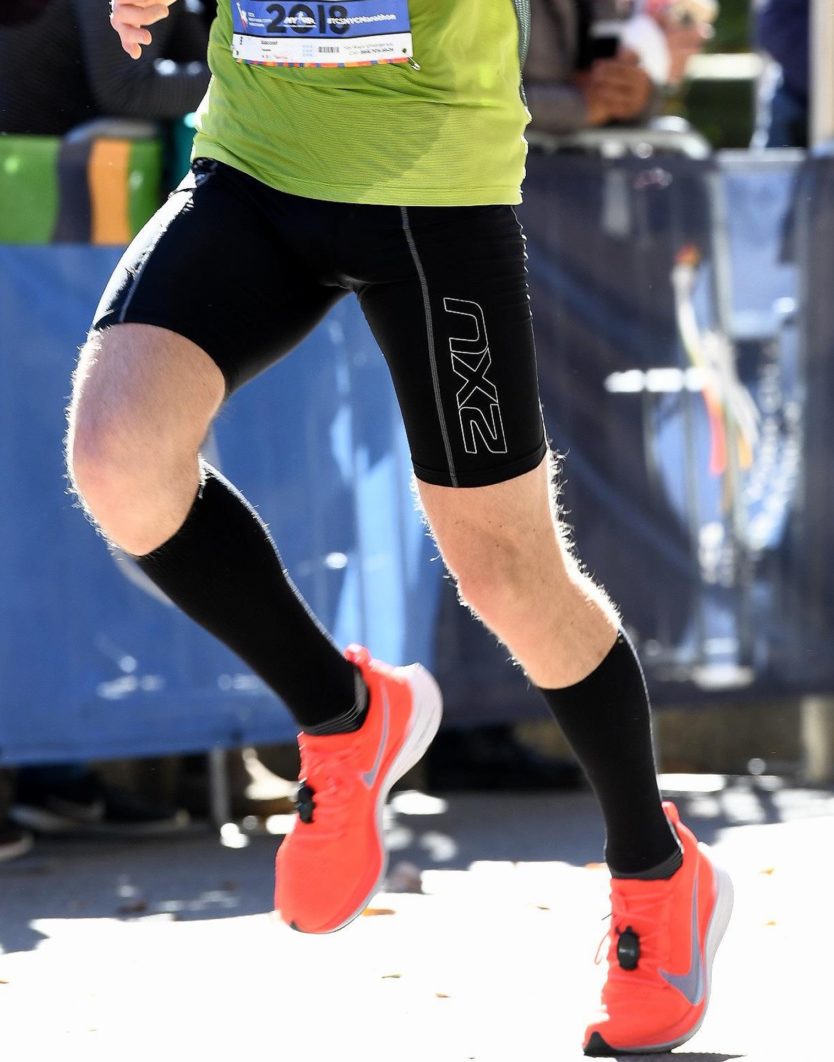
We were stoked to be back in NYC for the 2018 Marathon – getting pods out to over 50 runners to capture their data as they ran on what would turn out to be a perfect day in NYC! Positioning ourselves in Central Park at the Mile 25 marker, we watched (and waited), looking for pods while runners flew past … Read More
Inside Trail – Santa Cruz – Race Report
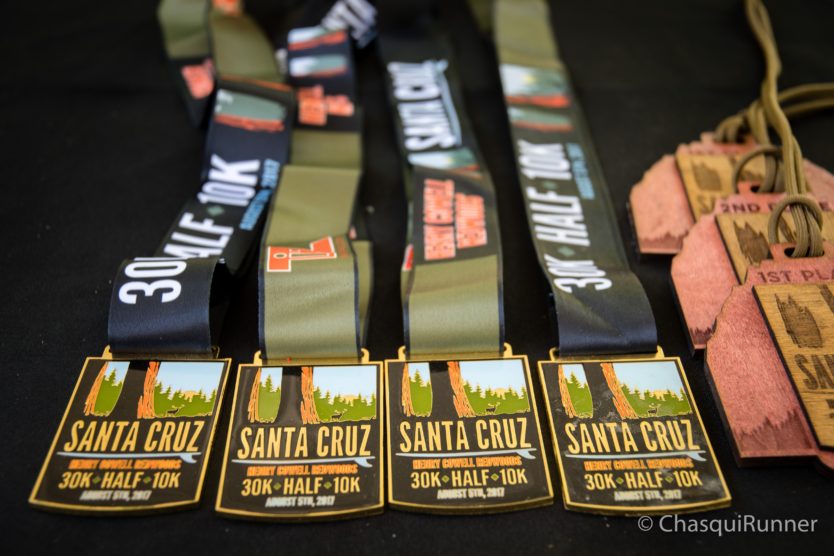
The week before our RunScribe Plus announcement, we had the pleasure of getting out from in front of our screens, heading down to Felton, a little town outside of Santa Cruz, CA. Inside Trail hosts a series of trail runs, with distances typically ranging from 10K to 30K, with some races including a 50K. We took down 12 demo sets, … Read More
Sacred Heart University — Validation
Influence of Placement on the Validity of RunScribe Michael Giambrone [Mentor: Dr. Matthew Moran] College of Health Professions Department of Physical Therapy and Human Movement Science This work was presented at the 2017 Sacred Heart University Academic Festival Original PDF : SacredHeart
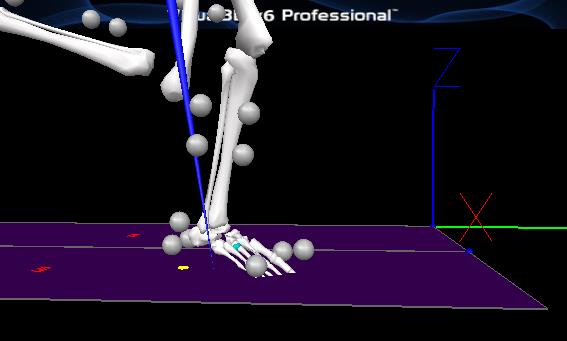
UNLV Research Study — Validation
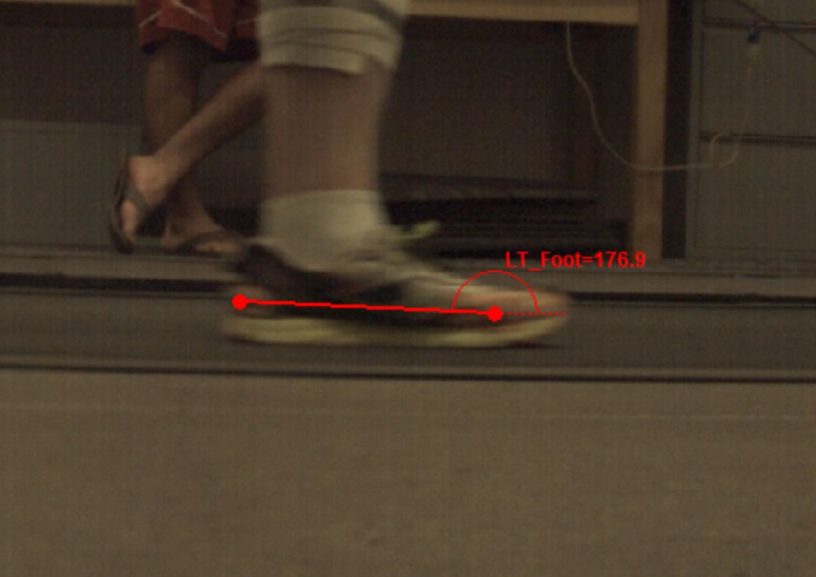
UNLV/RunScribe Study — Summer 2016 Purpose: The primary purpose of the project was to compare RunScribe metrics with high speed video and motion capture data measurements over an expanded range of running speeds and fitness levels. A secondary purpose was to investigate possible relationships between RunScribe metrics and running economy. Methods: Subjects Subjects: 23 runners. The runners represent a wide … Read More
The Risks & Rewards of Sports Tech for Running

This Simplifaster blog post discusses practical ways clincians and coaches are using sports technology in their programs.